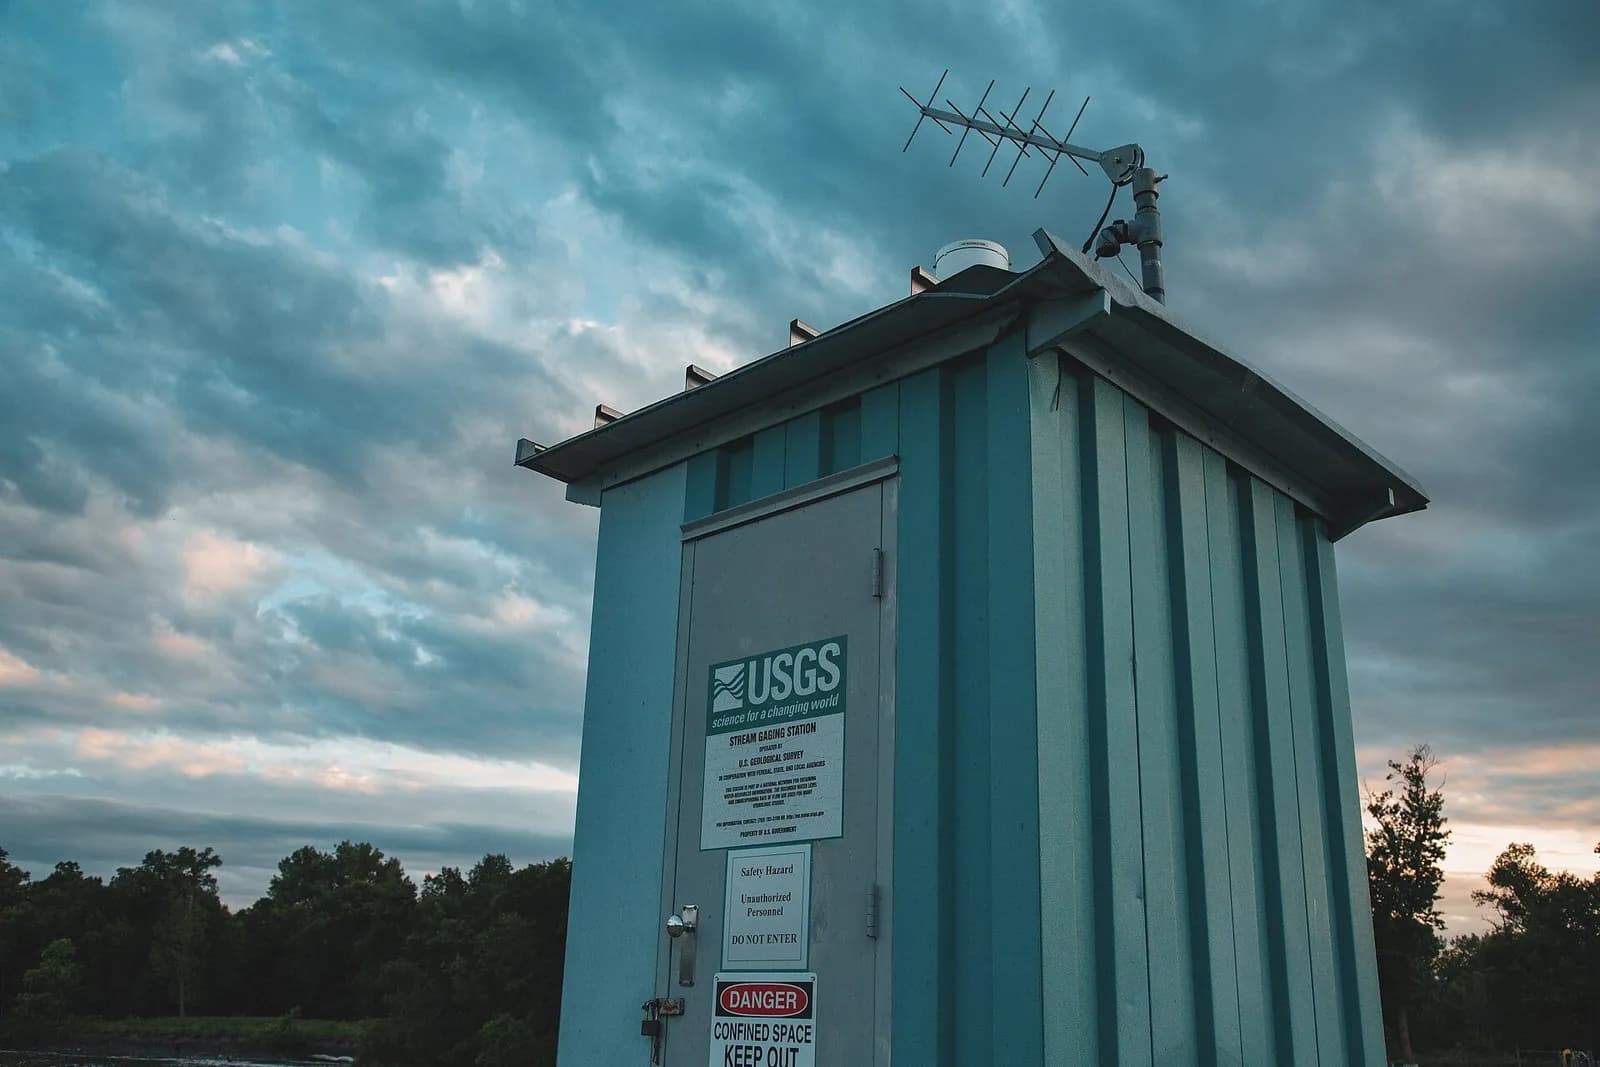
A USGS stream gaging station on the Minnesota River at Lac qui Parle Dam, Minnesota.Photo: Tony Webster, CC BY 2.0, via Wikimedia Commons
Check a river’s flow.
Search any USGS stream gauge by river or station name, by state, or near you. Each card shows the latest flow and how it compares with the normal range for today’s date; open a gauge for the full picture: trend, water temperature and what it means for trout, safety and the official NWS flood stage.
Search covers 11,178 USGS stream gauges that reported discharge, gauge height or water temperature in the 183 days before 2026-10-23 (USGS series catalog); readings are fetched live when a gauge is shown.
Where these numbers come from
Discharge, gauge height, water temperature and water quality: U.S. Geological Survey readings (provisional, can be revised), cached for 15 minutes. Where USGS publishes a gauge’s flow only once a day, the latest daily mean is shown with its date.
Normal range: the 25th to 75th percentile of daily mean flow for the same calendar day over the gauge’s record (USGS daily statistics), classed as USGS does (hyswap).
Temperature guidance for trout quotes the gauge’s own state fish and wildlife agency; where we found none, it says so and quotes federal guidance (National Park Service, U.S. Fish and Wildlife Service). Cold-water safety quotes the NWS; dissolved oxygen and pH are read against EPA criteria. Each line names its source.
General guidance, not a fishing forecast, a safety guarantee or a statement about access. Planning a trip? The trip planner shows these readings on every day you fish a water.
Release schedules: see operator. No public data feed carries this dam's releases. Maine's parks bureau points anglers and paddlers to Brookfield Renewable's SafeWaters page (or 1-844-430-FLOW) for flows.
No gauge on the Magalloway. Nearest: the Androscoggin River at Errol, below where the Magalloway joins (16.9 mi away). It does not measure the Aziscohos release on its own.
Limited data: Normal flow for the date:no water temperature here
No water temperature here.
Discharge
1,020 ft³/s
Gauge height
1.75 ft
Below normal for Nov 5 Steady · 24 h
Last 7 days
1,0001,0501,1001,150 ft³/s
Oct 29Nov 5
Discharge, last 7 days: 169 readings from Oct 29, 10:15 PM EDT to Nov 5, 9:15 PM EST; ranging 1,010 to 1,110 ft³/s; latest 1,020 ft³/s.
View data as a table
Discharge, last 7 days: readings, about hourly, newest first. USGS provisional data may be revised.
Checked Nov 5, 9:34 PM EST; readings refresh at most every 15 minutes and statistics daily. Provisional USGS data can be revised. Conditions change: re-check before you go. This is general guidance, not a fishing forecast, a safety guarantee or a statement about access.