
DIRTY DEVIL R AB POISON SP WSH NR HANKSVILLE UT
USGS 09333500 · UT · live flow · gauge height · 18.3 mi
Reading the gauge…
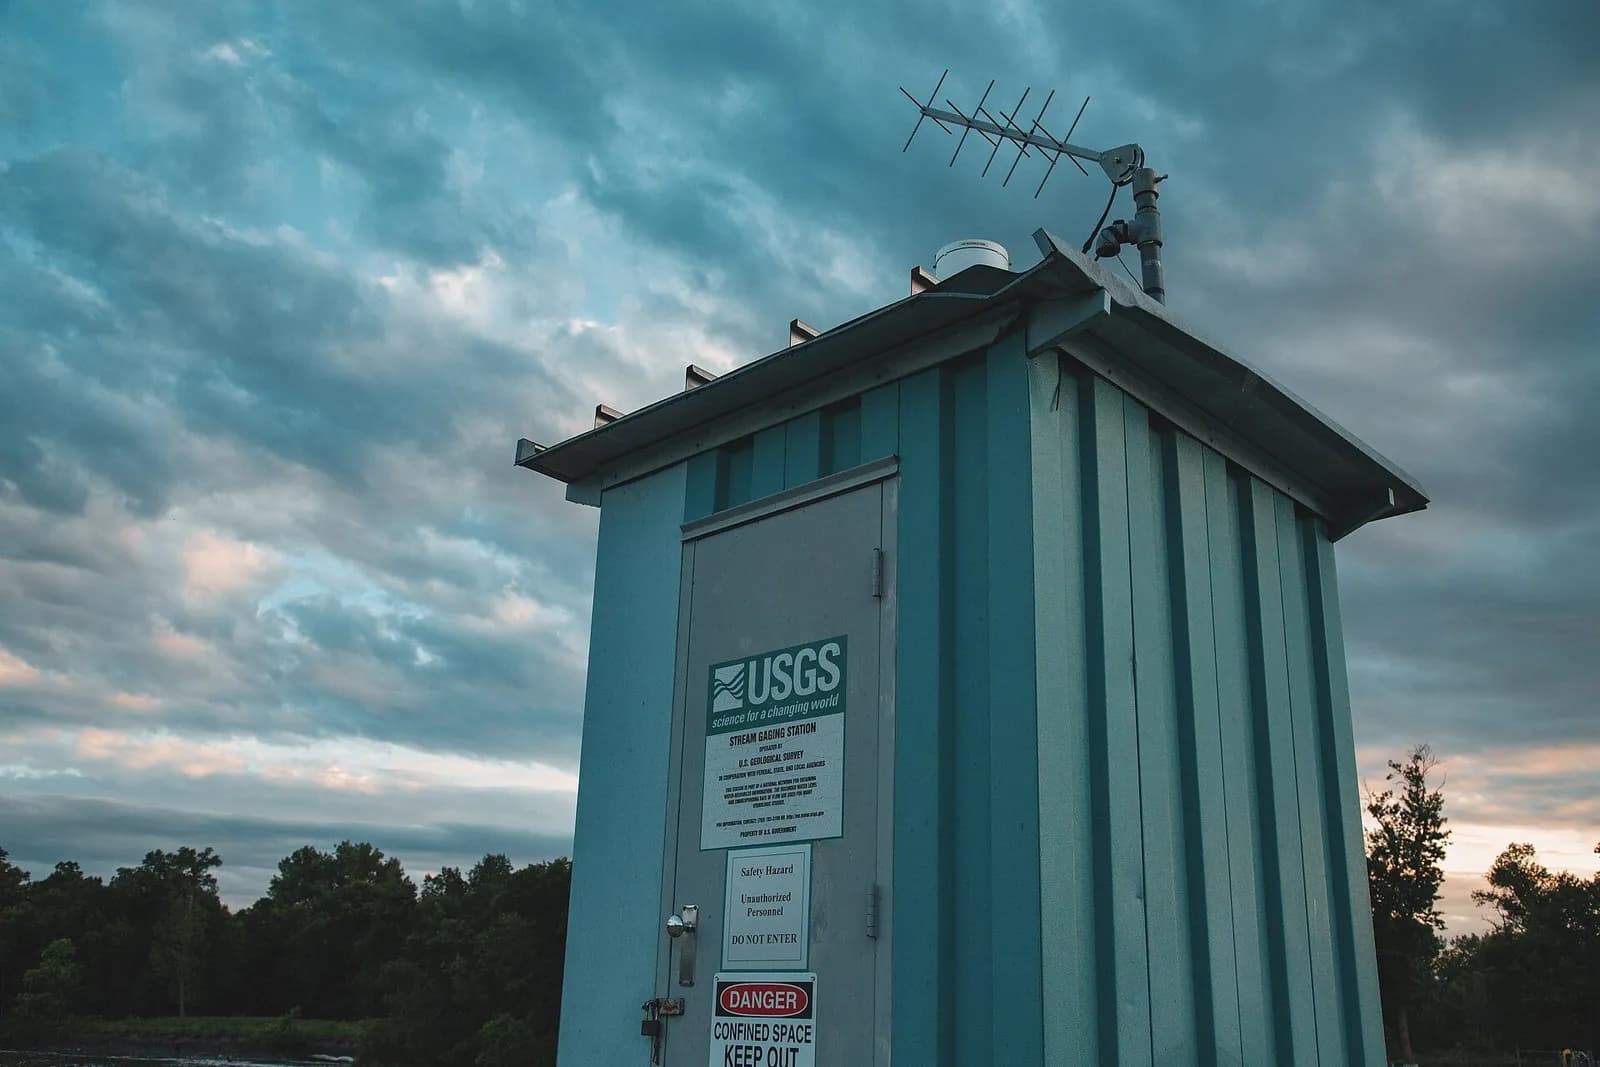
A USGS stream gaging station on the Minnesota River at Lac qui Parle Dam, Minnesota. Photo: Tony Webster, CC BY 2.0, via Wikimedia Commons
Search any USGS stream gauge by river or station name, by state, or near you. Each card shows the latest flow and how it compares with the normal range for today’s date; open a gauge for the full picture: trend, water temperature and what it means for trout, safety and the official NWS flood stage.
Your browser will ask before sharing your location. It is used once, rounded to about a kilometre, to list gauges within 30 miles, and is not stored.
USGS 09333500 · UT · live flow · gauge height · 18.3 mi
Reading the gauge…
USGS 09330250 · UT · live flow · gauge height · 22.4 mi
Reading the gauge…
USGS 09328990 · UT · no flow · gauge height · 23.8 mi
Reading the gauge…
Each state opens its USGS gauges and our water pages there; a water opens the live cards for its gauges, or the NOAA tides for flats and surf.
Search covers 11,178 USGS stream gauges that reported discharge, gauge height or water temperature in the 183 days before 2026-10-23 (USGS series catalog); readings are fetched live when a gauge is shown.
General guidance, not a fishing forecast, a safety guarantee or a statement about access. Planning a trip? The trip planner shows these readings on every day you fish a water.
USGS 09333500
Caution: High water: fish the edges; wading risky
No water temperature here. The full view adds the NWS forecast.
Much above normal for Nov 5 Falling · 24 h
Discharge, last 7 days: 27 readings from Nov 4, 5:30 PM MST to Nov 5, 7:30 PM MST; ranging 186 to 221 ft³/s; latest 191 ft³/s.
| Time | Discharge (ft³/s) | Gauge height (ft) |
|---|---|---|
| Nov 5, 7:30 PM MST | 191 | 5.59 |
| Nov 5, 6:30 PM MST | 193 | 5.6 |
| Nov 5, 5:30 PM MST | 186 | 5.56 |
| Nov 5, 4:30 PM MST | 188 | 5.57 |
| Nov 5, 3:30 PM MST | 190 | 5.58 |
| Nov 5, 2:30 PM MST | 193 | 5.6 |
| Nov 5, 1:30 PM MST | 193 | 5.6 |
| Nov 5, 12:30 PM MST | 193 | 5.6 |
| Nov 5, 11:30 AM MST | 191 | 5.59 |
| Nov 5, 10:30 AM MST | 190 | 5.58 |
| Nov 5, 9:30 AM MST | 190 | 5.58 |
| Nov 5, 8:30 AM MST | 191 | 5.59 |
| Nov 5, 7:30 AM MST | 195 | 5.61 |
| Nov 5, 6:30 AM MST | 198 | 5.63 |
| Nov 5, 5:30 AM MST | 200 | 5.64 |
| Nov 5, 4:30 AM MST | 196 | 5.62 |
| Nov 5, 3:30 AM MST | 196 | 5.62 |
| Nov 5, 2:30 AM MST | 202 | 5.65 |
| Nov 5, 1:30 AM MST | 202 | 5.65 |
| Nov 5, 12:30 AM MST | 203 | 5.66 |
| Nov 4, 11:30 PM MST | 209 | 5.69 |
| Nov 4, 10:30 PM MST | 212 | 5.71 |
| Nov 4, 9:30 PM MST | 212 | 5.71 |
| Nov 4, 8:30 PM MST | 216 | 5.73 |
| Nov 4, 7:30 PM MST | 219 | 5.75 |
| Nov 4, 6:30 PM MST | 217 | 5.74 |
| Nov 4, 5:30 PM MST | 221 | 5.76 |
Reading Nov 5, 7:30 PM MST · checked 7:52 PM MST
18.3 miles away in a straight line
USGS 09330250
Limited data: Not enough data: no water temperature or flow statistics here
No water temperature, flow statistics here.
Falling · 24 h
Discharge, last 7 days: 29 readings from Nov 4, 5:55 PM MST to Nov 5, 7:35 PM MST; ranging 33.6 to 41.3 ft³/s; latest 33.6 ft³/s.
| Time | Discharge (ft³/s) | Gauge height (ft) |
|---|---|---|
| Nov 5, 7:35 PM MST | 33.6 | 9.68 |
| Nov 5, 6:40 PM MST | 34.7 | 9.69 |
| Nov 5, 5:45 PM MST | 34.7 | 9.69 |
| Nov 5, 4:50 PM MST | 36.8 | 9.71 |
| Nov 5, 3:55 PM MST | 36.8 | 9.71 |
| Nov 5, 3:00 PM MST | 39 | 9.73 |
| Nov 5, 2:05 PM MST | 36.8 | 9.71 |
| Nov 5, 1:10 PM MST | 41.3 | 9.75 |
| Nov 5, 12:15 PM MST | 40.2 | 9.74 |
| Nov 5, 11:20 AM MST | 37.9 | 9.72 |
| Nov 5, 10:25 AM MST | 36.8 | 9.71 |
| Nov 5, 9:30 AM MST | 37.9 | 9.72 |
| Nov 5, 8:35 AM MST | 37.9 | 9.72 |
| Nov 5, 7:40 AM MST | 36.8 | 9.71 |
| Nov 5, 6:45 AM MST | 37.9 | 9.72 |
| Nov 5, 5:50 AM MST | 36.8 | 9.71 |
| Nov 5, 4:55 AM MST | 36.8 | 9.71 |
| Nov 5, 4:00 AM MST | 39 | 9.73 |
| Nov 5, 3:05 AM MST | 37.9 | 9.72 |
| Nov 5, 2:10 AM MST | 36.8 | 9.71 |
| Nov 5, 1:15 AM MST | 37.9 | 9.72 |
| Nov 5, 12:20 AM MST | 37.9 | 9.72 |
| Nov 4, 11:25 PM MST | 39 | 9.73 |
| Nov 4, 10:30 PM MST | 40.2 | 9.74 |
| Nov 4, 9:35 PM MST | 37.9 | 9.72 |
| Nov 4, 8:40 PM MST | 40.2 | 9.74 |
| Nov 4, 7:45 PM MST | 40.2 | 9.74 |
| Nov 4, 6:50 PM MST | 40.2 | 9.74 |
| Nov 4, 5:55 PM MST | 40.2 | 9.74 |
USGS 09328990
No current reading. USGS answered but returned no recent value for this gauge (ice, maintenance or a seasonal gauge).
No flow at this gauge. USGS does not publish discharge here, so there are no flow statistics either; it reports what is shown. Flow on the same river: COLORADO RIVER AT GYPSUM CANYON NEAR HITE, UT (USGS 09328960, 18.1 miles away).
On our page for Colorado River
23.8 miles away in a straight line
Checked Nov 5, 7:52 PM MST; readings refresh at most every 15 minutes and statistics daily. Provisional USGS data can be revised. Conditions change: re-check before you go. This is general guidance, not a fishing forecast, a safety guarantee or a statement about access.
Reading Nov 5, 7:35 PM MST · checked 7:52 PM MST
On our page for Fremont River
22.4 miles away in a straight line